Deep Analytics: The Numbers Most Event Platforms Never Show You
Most event management tools will tell you how many events you booked. Zenvents360 tells you why you lost the ones you did, which leads went dark and when, where your conversion rate breaks down, and exactly how your business is trending across every metric that matters.
Why basic reporting is not enough
A booked event count and a revenue total tell you what happened. They do not tell you what to do about it. Every event business that wants to grow - not just stay steady - needs to understand the patterns underneath the numbers. Where do leads go cold? Which months convert best? Are you losing more than you are winning, and if so, why?
Most platforms stop at the surface. Zenvents360 Deep Analytics was built to go further - pulling out the signals that actually drive business decisions.
Lead ghosting detection
This is the one that tends to surprise people. You know the feeling - a lead comes in, you respond, and then nothing. You follow up. Still nothing. Eventually you mark it lost and move on. But how many of those are you actually tracking? And is there a pattern to when they go quiet?
Lead ghosting tracking in Zenvents360 identifies leads that never advanced past the initial follow-up stage - meaning they made contact once, never engaged meaningfully with your business, and then disappeared. This is different from a lead you actively pursued who chose a competitor. A ghost was never really in the conversation.
Why does that distinction matter? Because the fix is different. If you are losing to competitors, that is a pricing or positioning problem. If you are being ghosted before you even have a real conversation, that is a response time problem, a communication style problem, or a funnel problem. You cannot fix one with the solution to the other.
Win/loss percentage analysis
Win rate is one of those metrics most event professionals think about in the abstract - "I book about 60% of my inquiries" - but rarely actually measure. Zenvents360 tracks it precisely, and more importantly, breaks it down across dimensions so you can see where the wins and losses actually cluster.
Are you winning at a higher rate in certain months? Losing more often when inquiries come in through a particular channel? Closing at a lower rate when certain package tiers are involved? These are questions that raw numbers cannot answer on their own - but win/loss analysis by segment can.
The goal is not just to know the number. It is to know where to focus your energy to move it.
Where your leads are actually coming from
The Lead Source Trends chart shows each channel as a curved line over time - so you can see when Google Search started pulling ahead, when a bridal show stint paid off, or when Instagram referrals trailed off. The stacked volume chart next to it layers all those same sources into yearly bars, letting you compare total inquiry volume across channels in a single view. Together they answer two different questions: how is each source trending, and how much does each one actually contribute?
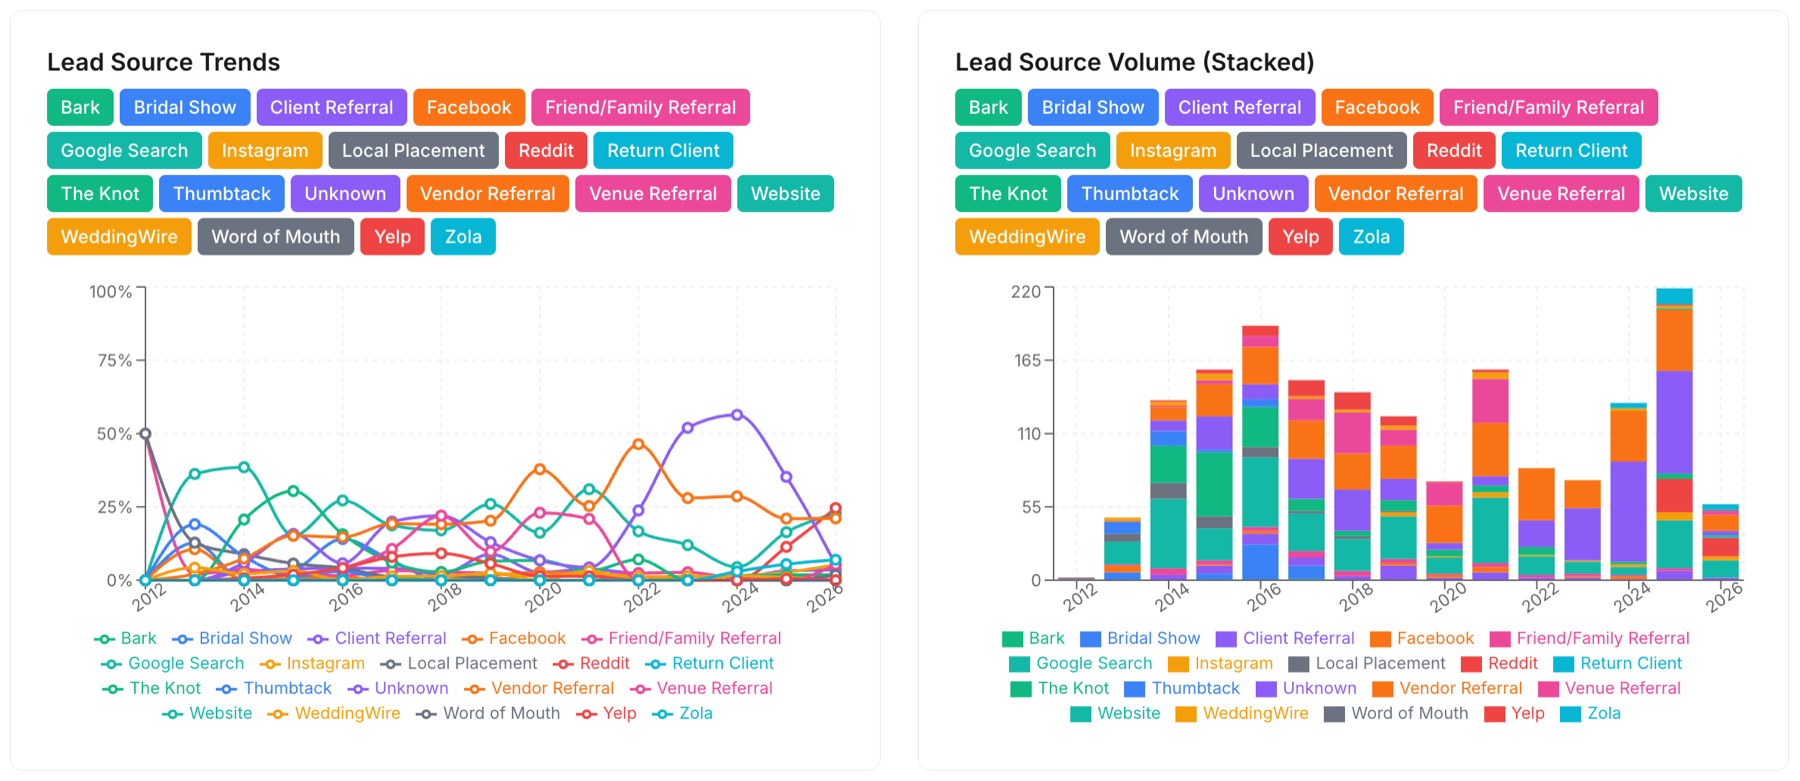
Lead Source Trends and Volume - see exactly which channels (Google, Instagram, The Knot, referrals, and more) are sending inquiries, and how that mix has shifted year over year
Inquiry heatmaps - and no other event CRM has them
The inquiry heatmap is one of the most visually distinctive features in Zenvents360 Deep Analytics - and as far as we are aware, no other event CRM on the market offers anything like it. Every month of every year you have been in business is laid out in a single grid, color-coded by inquiry volume. The darker the cell, the busier that month. At a glance, you can see your entire career as an event professional mapped out across a calendar.
Each row also shows the full outcome breakdown for that year - raw inquiries, unavailable dates, adjusted inquiries, cold leads, proposals sent, lost, and booked. You are not just seeing when inquiries came in. You are seeing what happened to them.
For event businesses that have been operating for a few years, the heatmap reveals patterns that are genuinely surprising - and genuinely actionable. Maybe your January inquiry volume has been climbing for three years but your booked count stays flat. Or September always spikes but October drops off a cliff. Seeing that pattern visually makes it real in a way a table of numbers never quite does.
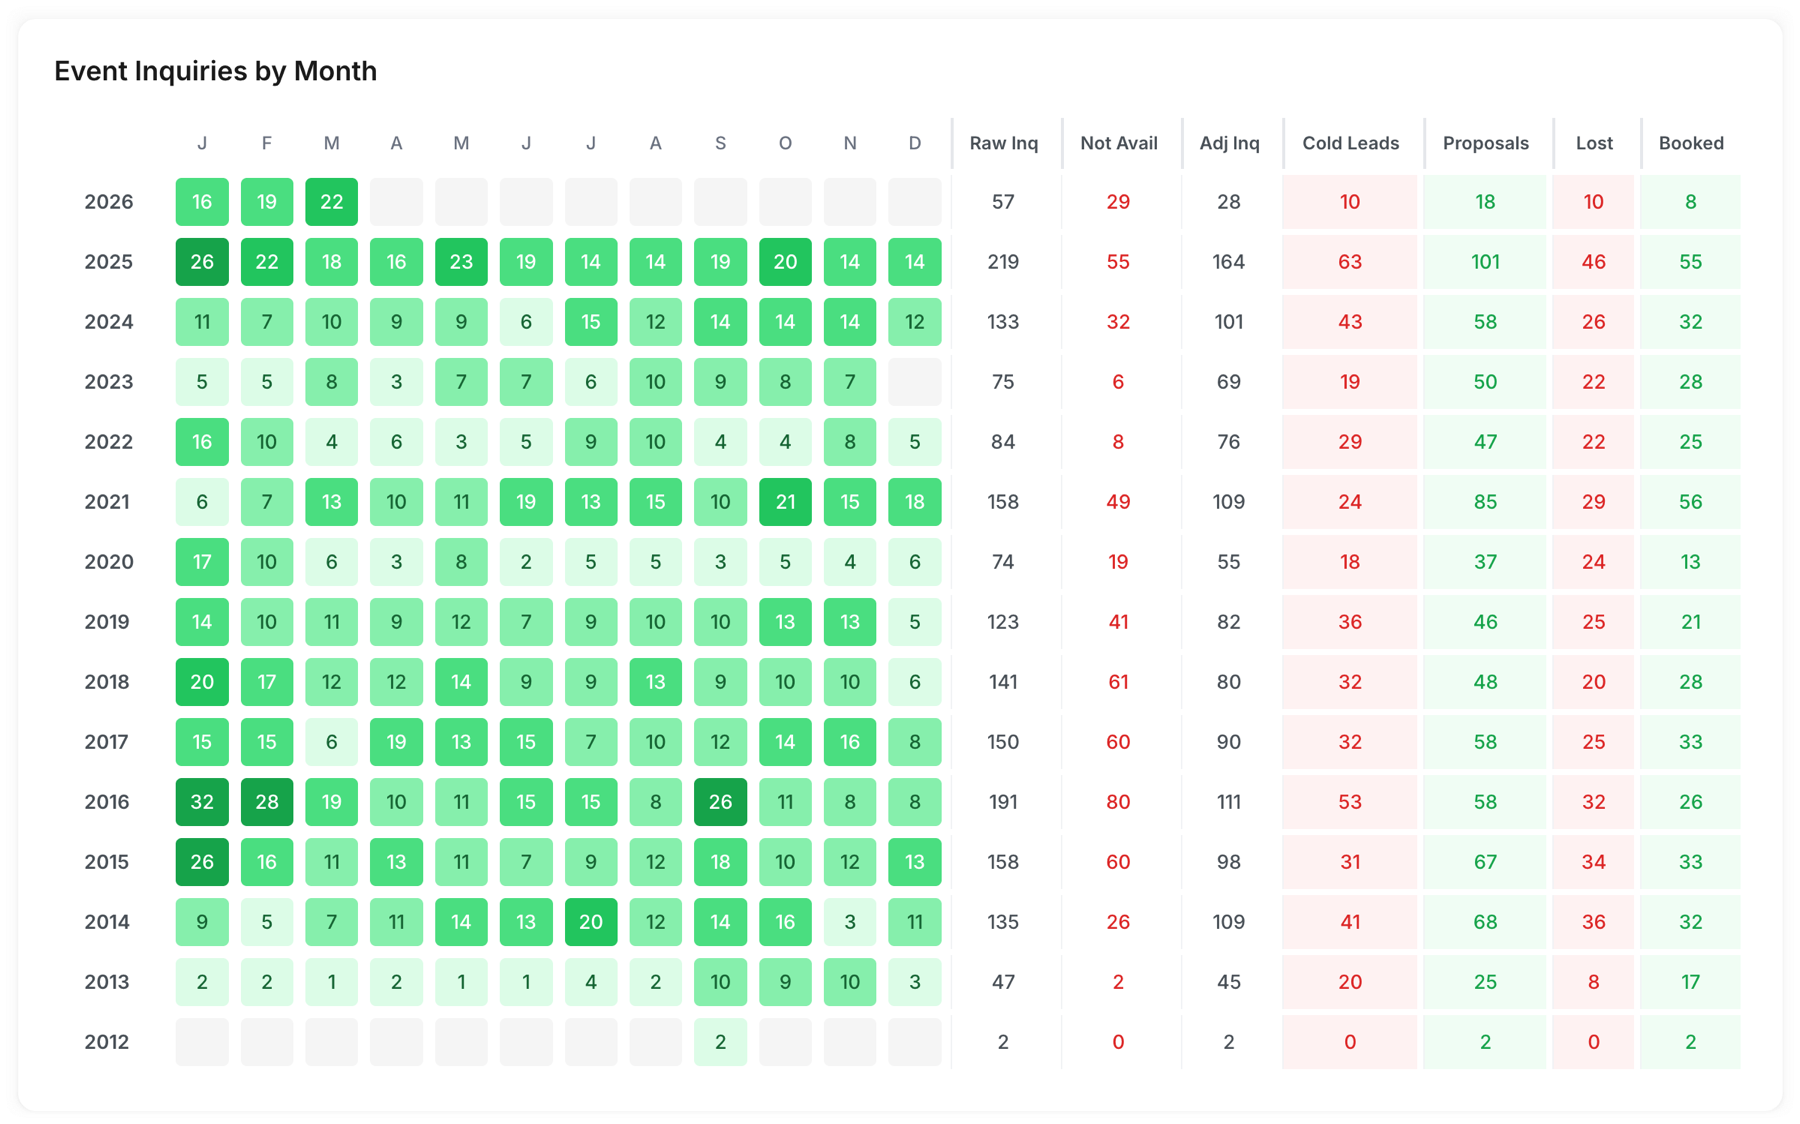
Every month, every year - color intensity shows inquiry volume at a glance, with full outcome breakdowns (inquiries, cold leads, proposals, lost, booked) per row
The full KPI picture
Beyond the leading indicators, Deep Analytics gives you a comprehensive KPI dashboard - revenue tracked against goals, lead volume over time, average deal size, time-to-close, pipeline velocity, and more. Everything in one place, updated in real time as your business moves.
The intent is not to drown you in numbers. It is to make the health of your business instantly readable - so you can make decisions with confidence rather than instinct alone. Most event professionals run on intuition built from experience, and that works. Coupling it with accurate data makes it work better.
Knowing your numbers is not a corporate concept. It is how small businesses grow into bigger ones. Deep Analytics puts that capability in the hands of every event professional who uses Zenvents360, regardless of how big or small their operation is right now.
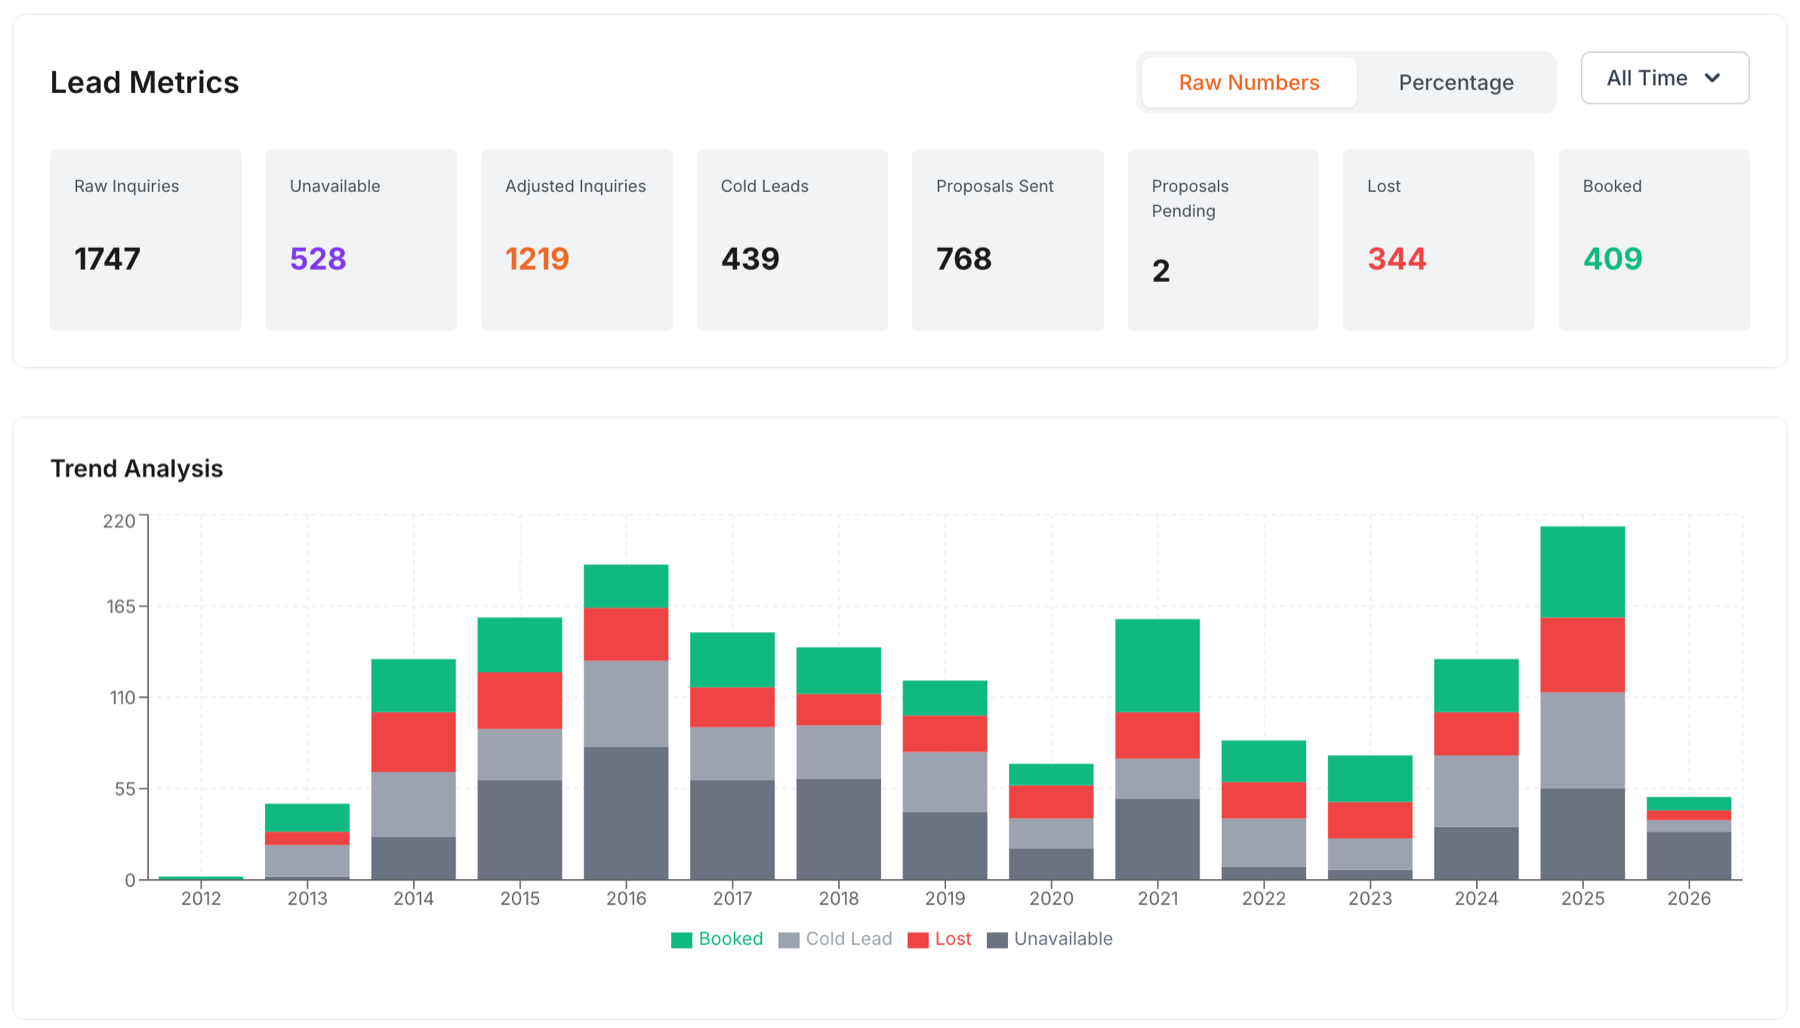
The full picture - top-line KPIs and a year-by-year trend analysis that shows how booked, lost, cold, and unavailable leads have stacked up across your entire history
Know your business the way the numbers do
Deep Analytics is live in Zenvents360 now.
Start Free Trial →Lou Paris
Founder of Zenvents360. 30+ years in the event industry. Built this because someone said he couldn't.