Views No Other Event CRM Has
Most calendar tools show you a grid of boxes. Most CRMs show you a table of rows. Zenvents360 was built by someone who has run events for 30 years - and that shows in how information is displayed. Four views in the platform exist nowhere else in any event management software on the market.
The yearly calendar with weekend alignment
Every event professional thinks in weekends. Inquiries come in by date, but your brain immediately translates that date to: Saturday or Sunday? Which weekend of the month? How close is the next one?
The standard yearly calendar view that most tools offer is a 12-block grid of months - each one independently laid out with days starting wherever they happen to fall that year. You cannot compare December 7th and June 7th at a glance, because they are on completely different rows in completely different orientations.
The Zenvents360 yearly calendar lays every month in a single continuous row format, with weekends permanently aligned in their own columns. Saturday and Sunday are always in the same visual position, every month, all year. You can look at any row and immediately see which weekends are booked, which are open, and how dense your season is - without doing any mental translation at all.
Events are color-coded by status - Booked, Signed, Proposal Sent, Meeting, Subcontract, Blackout, and Holiday - so the whole picture of your year is readable at a single glance. On days with multiple events, the cell shows a charm indicator: a number badge telling you exactly how many events are scheduled that day, so a busy Saturday never just looks like a single colored square.
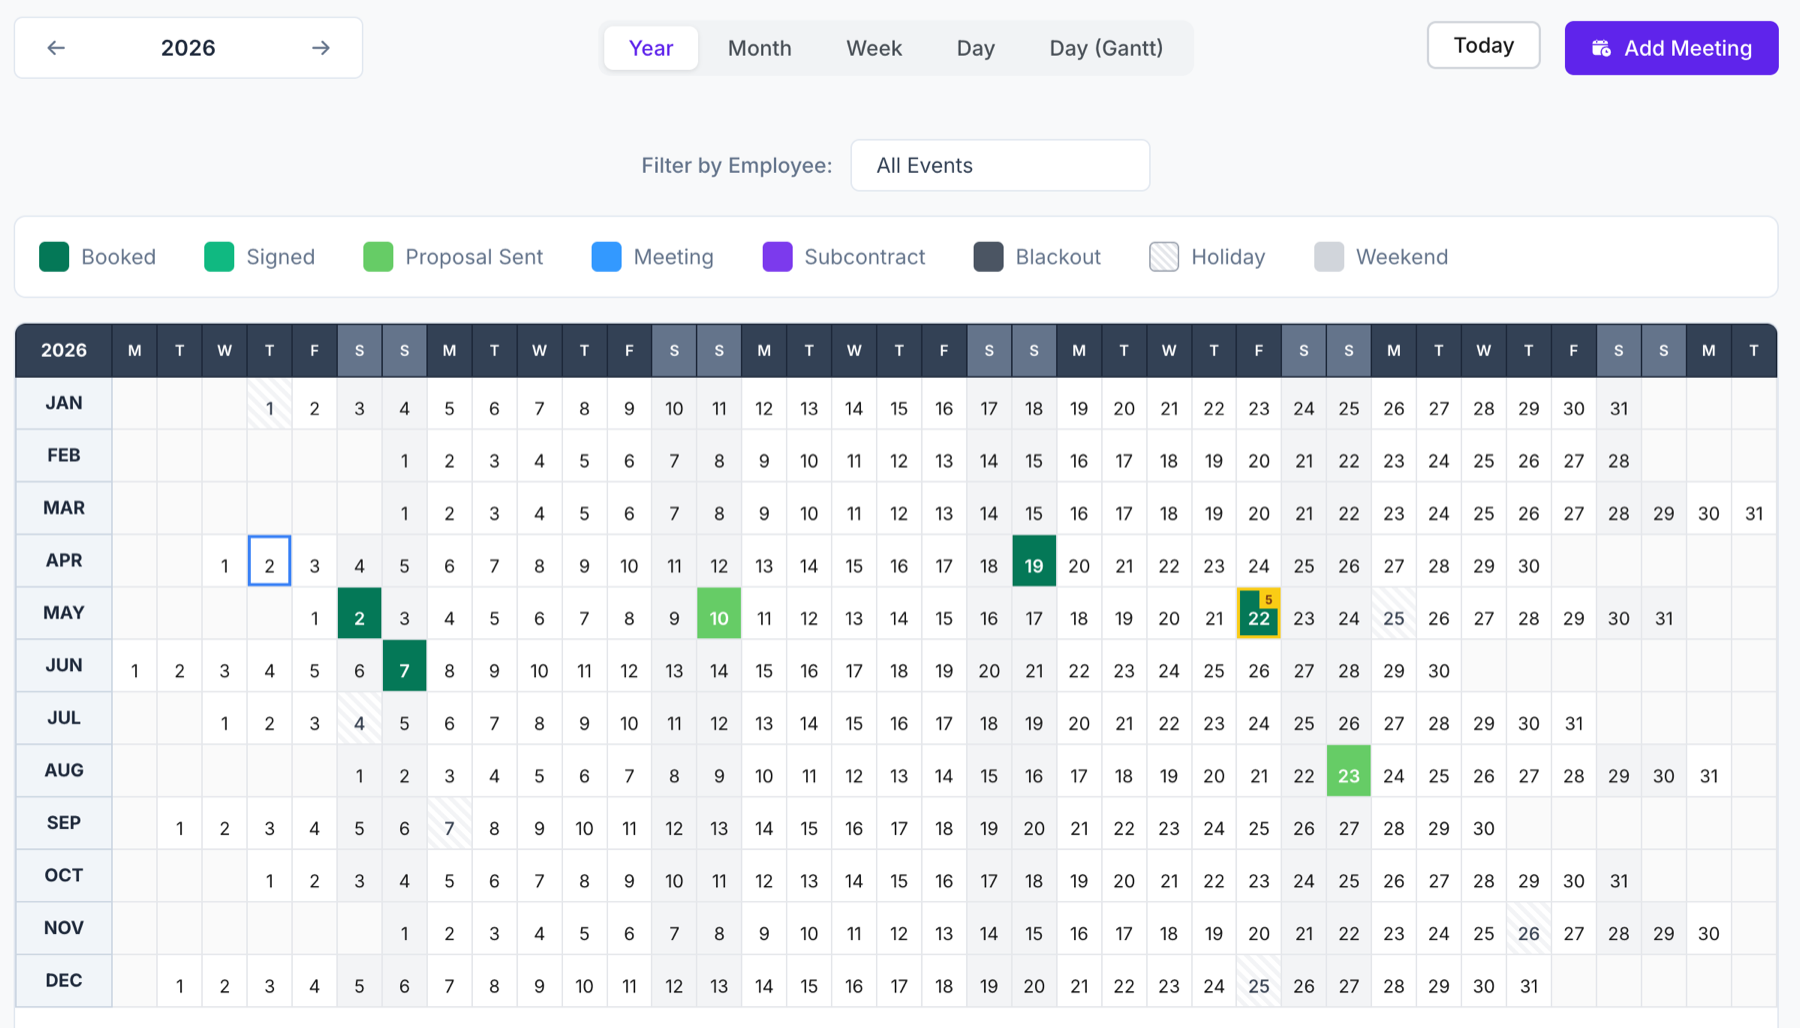
The full year - weekends locked in their own columns so you can scan your entire season without translating a single date
The Gantt day view for multi-op organizations
When you are running multiple events on the same day - a common reality for multi-op organizations - a standard day view collapses everything into a single column. Events stack, overlap, and become impossible to read at a glance.
The Day Gantt view in Zenvents360 spreads every event for the day out horizontally on a timeline. Each event gets its own row, with a bar spanning exactly the hours it runs. You can see a morning corporate event, two overlapping afternoon weddings, and a late-night gig all on the same screen - each one readable, each one distinct.
For scheduling decisions - can we take another booking that night? Who is free from 3 PM? - this view answers the question before you have to ask it. No other event CRM on the market offers a Gantt day view. This is a capability that event management software simply has not had before Zenvents360.
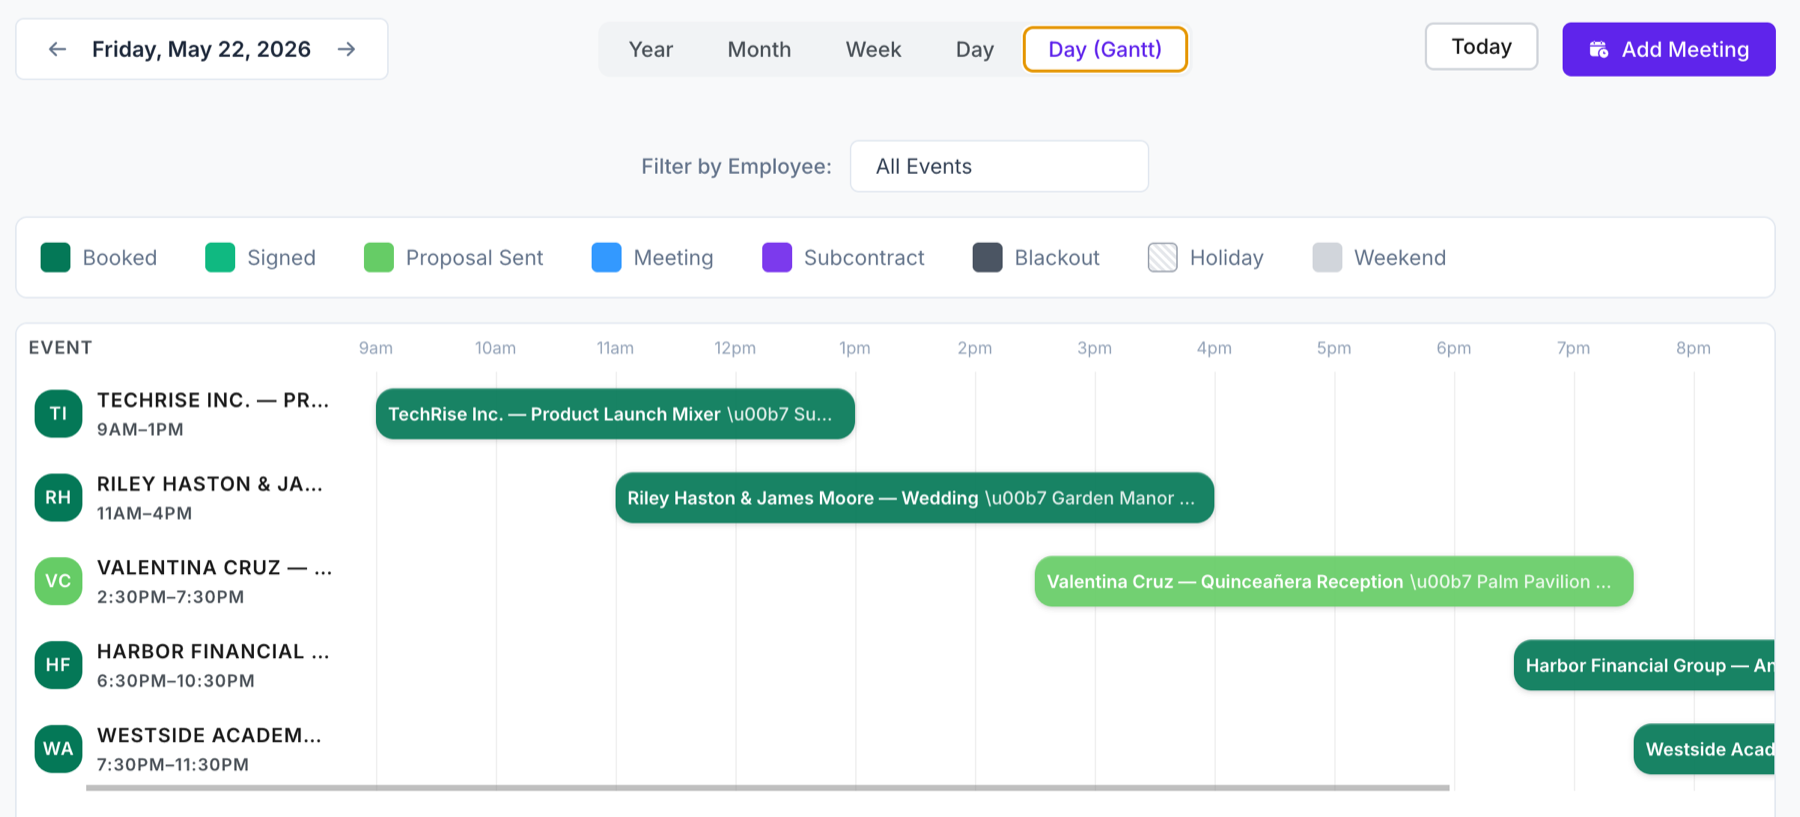
Four events on one day - each running at a different time, each instantly readable on a shared timeline. Grand Opening at 10AM, a corporate event at 2PM, two late-night weddings at 6PM
The per-event employee schedule Gantt
Inside each individual event, there is a Schedule tab that shows your assigned personnel laid out on their own Gantt. Each employee or subcontractor gets a row, with their assignment window shown as a bar on the event timeline.
For a complex event with a Lead DJ, a host, a lighting operator, and a venue coordinator each arriving and leaving at different times - this view makes coverage gaps both visible and fixable. You are not reading a list of names and trying to mentally reconstruct who is on the floor at 8 PM. The chart shows you.
This is also the view that answers the question no standard event software can answer: at any given moment during your event, who is supposed to be there? The per-event Gantt makes that question disappear, because the answer is always on screen.
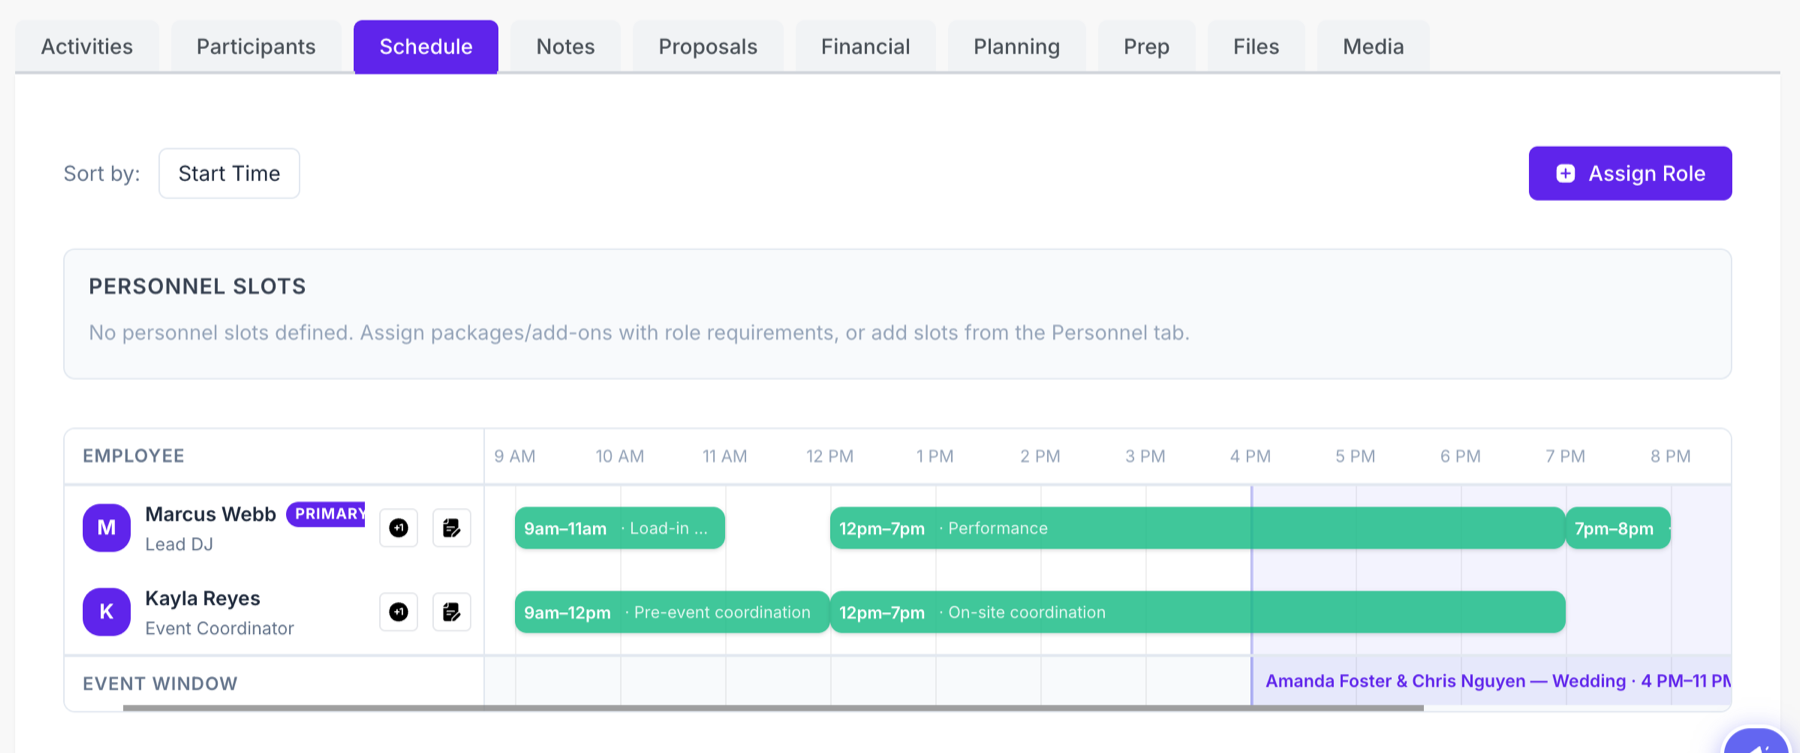
The event Schedule tab - each assigned staff member on their own row, with their window plotted against the full event timeline
The inquiry heatmap
The fourth view is not a calendar - it lives in Deep Analytics. Every month of every year you have been in business is laid out in a single grid, color-coded by inquiry volume. The darker the cell, the more inquiries came in that month. Rows span years. Columns span months. Your entire history as an event professional is visible in one screen.
Each row also shows the outcome breakdown for that year - raw inquiries, unavailable, cold leads, proposals sent, lost, and booked. You are not just seeing when people reached out. You are seeing what happened to every one of them, organized by year, readable in seconds.
No other event CRM has this view. We looked. Read the full Deep Analytics article for a closer look.
Why views matter as much as features
Software can store all the right data and still be useless if the data is hard to read. The reason most event CRMs end up supplemented with spreadsheets, whiteboards, or mental gymnastics is not that they are missing features - it is that they do not surface information in the way the human brain actually processes it.
Event professionals think spatially. They think in timelines, in patterns, in visual density. A weekend-aligned yearly calendar, a multi-event Gantt day view, an employee schedule Gantt, and an inquiry heatmap are not just nice extras. They are the difference between a tool you consult and a tool you trust.
Lou Paris
Founder of Zenvents360. 30+ years in the event industry. Built this because someone said he couldn't.